
Desk: Uncategorized Desk
Published: September 19, 2026
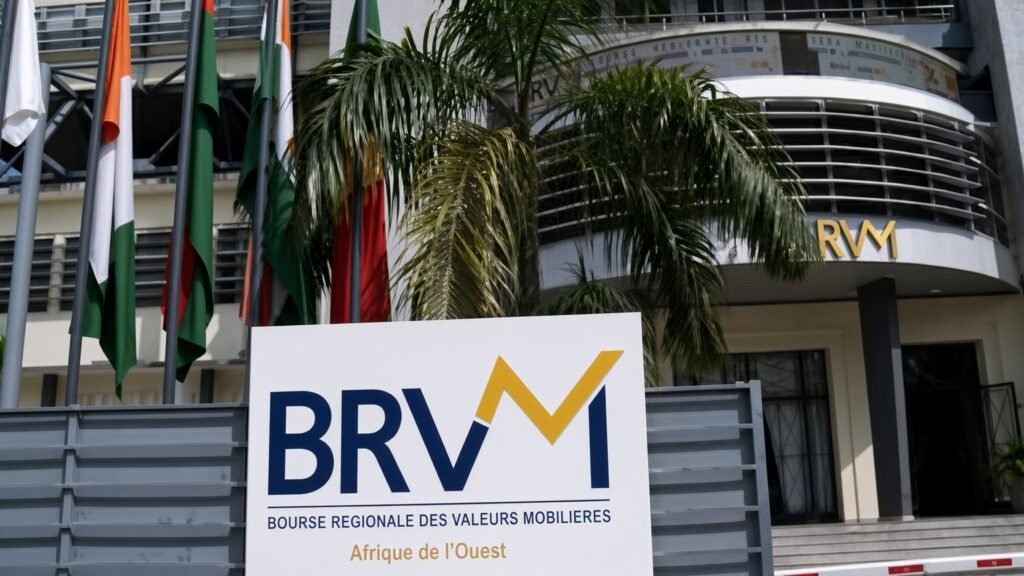
The BRVM Composite reached a record 555.48 points in the week ended September 11, 2026. But 25 listed stocks fell while only 20 rose. That divergence an index at a new high while more constituents decline than advance is the analytical centre of the current phase of West Africa’s equity rally. The record is a capitalization event driven by a small number of heavily weighted names, not a broad market signal. Sonatel Senegal alone accounted for 20.87% of weekly equity turnover, three stocks combined for more than a third, and the widest individual move of the week was SAPH Côte d’Ivoire’s 17.12% decline after an 88% collapse in first-half net profit. Equity market capitalisation reached XOF 21.42 trillion, with the Composite up approximately 60.7% for the year. The question for investors is no longer whether the rally happened. It is which stocks are actually carrying it and whether earnings can validate the repricing that has already occurred.
Read the weekly data carefully and a contradiction emerges. The BRVM Composite gained 1.25% during the week to reach a record 555.48 points. The BRVM 30 rose 1.42% to 269.06. The Prestige Index gained 1.00% to 201.81 and the Principal Index rose 0.43% to 407.43. Every headline index advanced.
Yet beneath those gains, the market narrowed. Twenty stocks advanced, twenty-five declined and two were unchanged. Trading volume increased 2.99% to 7.35 million shares, but the value of transactions fell 4.38% to XOF 13.56 billion meaning more shares changed hands while less capital was deployed. The headline number moved one direction; the underlying participation moved the other.
Analytical framing note: This article treats the BRVM Composite’s record level as distinct from the breadth of market participation. An index can reach a new high while the median constituent declines when a small number of heavily weighted securities carry disproportionate influence over the index level. The distinction is not a prediction about future index direction it is a description of what the 555.48-point figure actually reflects in the current market structure.
Sources: BRVM weekly market data, Daba Finance • Analysis: Limitless Beliefs Consulting
The Record Is Real The Breadth Is Not
The BRVM Composite’s move to a record is not manufactured. It reflects genuine price appreciation in the securities that carry the heaviest index weight most importantly Sonatel, Orange Côte d’Ivoire and Société Générale Côte d’Ivoire. Those are the names that move the Composite. And in the week to September 11, several of them moved up: Orange Côte d’Ivoire gained 6.85% to XOF 22,450, Vivo Energy Côte d’Ivoire gained 6.25% to XOF 2,550, and BOA Mali led the weekly gainers with an 11.72% advance to XOF 7,150.
But the participation was not there. The 25 declining stocks against 20 advancing is the widest negative breadth reading of the recent rally period. And the divergence between volume (+2.99%) and transaction value (−4.38%) tells a second story: the shares changing hands were relatively lower-priced. The market was active, but the capital intensity per trade fell.
This is what a capitalization event looks like in practice. The index reflects the sum of weighted prices. If the heavily weighted names rise, the index rises regardless of what the median stock does. When 25 of 47 listed securities decline in the same week that the index hits a record, the index is doing precisely what it is designed to do. It is not, however, describing the experience of the average investor in an average listed company.
“A record index level and a declining median stock are not contradictory. They are the same fact, viewed from two different angles.”
Sonatel Alone Is One-Fifth of Weekly Turnover The Liquidity Is Real, but Narrow
The concentration of trading activity reinforces the same pattern. Sonatel Senegal remained the most traded stock for the third consecutive week, accounting for XOF 2.83 billion, or 20.87% of total weekly equity turnover. Société Générale Côte d’Ivoire represented 8.19%. BIIC Benin accounted for 5.90%. Together, three stocks — out of the 47 listed on the exchange — represented more than one-third of all reported equity transaction value.
The remaining 44 stocks shared approximately 65% of turnover, but that share was heavily skewed toward a subset of mid-cap names. For investors holding smaller-cap or thinly traded securities, this concentration creates a specific risk: even if the position appreciates on paper, converting that appreciation into realised cash requires a counterparty — and in a market where trading value is concentrated in a handful of names, that counterparty may not appear at the desired price.
Sources: BRVM, Daba Finance • Analysis: Limitless Beliefs Consulting
The bond market provides a partial counterweight. Bond market capitalisation stood at approximately XOF 12.72 trillion, down 0.34% during the week. Bond trading reached approximately XOF 3.4 billion, with Senegal’s 6.75% 2025–2032 bond accounting for 84.89% of bond turnover after 300,000 securities worth XOF 2.8 billion changed hands. The bond market, in other words, is even more concentrated than the equity market — and its most active instrument is a Senegalese sovereign security whose credit profile is under active scrutiny. Any deterioration in Senegal’s sovereign financing situation would have outsized influence on the regional bond market’s liquidity and pricing.
The Market Has Started to Differentiate Orange Rises, SAPH Falls 17%
If the breadth data describes the shape of the rally, the individual stock moves describe what is beginning to matter within it. Two names dominate the week’s extremes. Orange Côte d’Ivoire gained 6.85% to XOF 22,450 a large-cap telecommunications operator with visible cash flows, a clear dividend history and a business model that does not depend on volatile commodity cycles. SAPH Côte d’Ivoire fell 17.12% to XOF 8,300 after reporting an 88% year-on-year decline in first-half net profit.
The contrast is the analytical signal. In a market where the index has already advanced approximately 60.7% year-to-date, the repricing of individual securities is increasingly being driven by earnings surprises rather than broad multiple expansion. Companies that deliver earnings growth can support higher valuations. Companies that miss particularly with the magnitude of SAPH’s decline face immediate and severe corrections, regardless of how strong the broader index appears.
SAFCA fell 11.04% over the same week, and NEI-CEDA declined 8.33% partly reflecting an ex-dividend adjustment. Together with SAPH, these three names illustrate that the market’s 25 declining stocks are not a homogenous group. Some reflect earnings deterioration. Some reflect technical adjustments. Some reflect sector specific pressures. But all of them occurred in the same week that the Composite hit a record.
Sources: BRVM, Daba Finance • Analysis: Limitless Beliefs Consulting
BCEAO Holds at 3% The Backdrop Is Supportive, Not Decisive
The monetary backdrop remains accommodative relative to the high-inflation period that affected many African markets earlier in the decade. The BCEAO Monetary Policy Committee kept its principal policy rate at 3.00% on September 9, 2026, with the marginal lending facility at 5.00% and the reserve requirement coefficient at 3.00%. The IMF reported that WAEMU growth reached 6.6% in 2025 and projected regional growth of approximately 5.5% in 2026. Inflation fell below the WAEMU target range from mid-2025, and reserves reached 7.8 months of prospective imports in February 2026.
These conditions support equity valuations at the margin a 3% policy rate lowers the discount rate applied to future corporate cash flows and reduces pressure on nominal financing conditions. But they do not resolve the two constraints that matter more for the current phase of the rally. First, the BCEAO’s policy rate is a short-term benchmark, not a direct read on what investors must pay for equity risk in a market where more than a quarter of weekly trading is concentrated in a single stock. Second, the IMF has separately identified sovereign financing needs, elevated public debt in some member states, high bank exposure to sovereign debt and financial-sector vulnerabilities as continuing risks. The monetary environment supports the rally without determining whether individual valuations can be sustained.
Senegal’s sovereign credit situation is the specific risk worth monitoring. Recent reporting has highlighted the country’s proposed external debt treatment and concerns about debt sustainability. The 6.75% 2025–2032 bond represented 84.89% of weekly bond turnover which means that if Senegal’s credit profile deteriorates, the effect flows directly through the region’s most-traded sovereign instrument and, by extension, through the bank balance sheets that hold it.
Sources: LBNN Intelligence, BRVM, BCEAO, IMF • Analysis: Limitless Beliefs Consulting
Sources: LBNN Intelligence, BRVM, BCEAO, IMF • Analysis: Limitless Beliefs Consulting
From Momentum to Fundamentals The Rally’s Second Phase
The BRVM’s rally is entering a phase where the analytical discipline required is different from what produced the first 60% of returns. In the first phase, broad participation in a re-rating environment meant that simply owning the Composite produced the market’s return. In the second phase, the differentiation is already visible: Orange Côte d’Ivoire gained 6.85% while SAPH lost 17.12% in the same week, and the index hit a record while 25 stocks declined.
This is a normal transition for a market emerging from a period of depressed valuations. Re-ratings can move quickly because they reflect a change in the discount rate rather than a change in the underlying cash flows. Earnings growth compounds more slowly. When the re-rating is largely complete as the 60.7% Composite advance suggests the next phase of returns depends on whether the cash flows arrive.
For investors, the framework should shift accordingly. Rather than asking whether the BRVM Composite can reach the next milestone, the more productive questions are: Which companies can grow earnings through the current cycle? Which valuations already price in that growth? Which securities offer enough liquidity to exit a position without materially affecting the price? The first question is answered by company disclosures. The second requires comparing price to earnings, price to book and dividend yields against sector appropriate benchmarks. The third is answered by the turnover concentration data and that data currently suggests the answer is favourable for fewer stocks than the headline index would imply.
The regional macroeconomic backdrop remains supportive. WAEMU growth of 6.6% in 2025 and a projected 5.5% in 2026 is materially above the IMF’s approximately 3% global growth projection for 2026. That growth differential creates a legitimate reason for the BRVM to command higher valuations relative to other frontier markets. But a growth differential is not the same as an earnings guarantee for any specific listed company and the market’s 2026 divergence between gainers and decliners is beginning to make that distinction visible.
Bottom Line: The BRVM Composite’s record 555.48 points is a genuine milestone, and the approximately 60.7% year-to-date gain is a real return for investors who held through the rally. But the record is a capitalization event, not a breadth event. Twenty-five stocks declined while only 20 advanced in the week the index peaked. Sonatel alone accounted for 20.87% of weekly equity turnover, three stocks combined for more than a third, and the widest single move of the week was SAPH Côte d’Ivoire’s 17.12% decline after an 88% earnings collapse. Volume rose 2.99% while transaction value fell 4.38% the market was more active in shares without deploying more capital. The BCEAO’s 3.00% policy rate and WAEMU’s 6.6% 2025 growth provide a supportive backdrop, but they do not resolve the earnings test that the market has begun to apply to individual names. The bond market is even more concentrated Senegal’s 6.75% 2025–2032 bond alone represented 84.89% of weekly bond turnover which means any deterioration in Senegal’s sovereign credit profile flows directly through the region’s most traded fixed income instrument. The next phase of the BRVM’s cycle will not be decided by whether the Composite can reach another numerical milestone. It will be decided by whether the earnings, dividends and cash flows of the exchange’s listed companies can validate the valuation expansion that has already occurred. In a market where 25 stocks fall while the index rises, the analytical work of stock selection becomes materially more important than it was in the rally’s first phase.
Data Qualification: This article combines weekly BRVM market data with macroeconomic indicators from the BCEAO and IMF. Market figures for the week ended September 11, 2026 are drawn from BRVM market data and contemporaneous market reporting, including Daba Finance. Reported 2026 gains for the Composite, BRVM 30 and Principal Index are as published by those sources; where they are described as 2026 gains, they should be distinguished from individual daily BRVM index snapshots, which are the official recorded values on any given trading date. Breadth figures (20 advancers, 25 decliners, 2 unchanged) and turnover concentration figures (Sonatel 20.87%, Société Générale Côte d’Ivoire 8.19%, BIIC Benin 5.90%) reflect reported weekly market data. Bond market data including the XOF 12.72 trillion capitalisation and the Senegal 6.75% 2025–2032 bond’s 84.89% share of bond turnover are as reported for the week. BCEAO monetary policy rates reflect the September 9, 2026 Monetary Policy Committee decision. WAEMU growth figures reflect IMF regional projections. The analytical framing that distinguishes a “capitalization event” from a “breadth event” is an LBNN/Limitless Beliefs Consulting interpretive framework and is not an institutional market classification. Derived calculations are identified as Limitless Beliefs Consulting calculations and are not official forecasts.