
Desk: Uncategorized Desk
Published: September 17, 2026
The headline from Nairobi is that Africa has a US$4 trillion institutional capital pool and only 2.7% of it is in productive sectors. The sharper story is that the savings pool and the instrument pool are moving in opposite directions. Kenya’s pension assets alone grew from KSh 2.531 trillion to KSh 3.167 trillion in a single year a 25.13% increase. Over a longer horizon, the continent’s equity market capitalisation expanded 27 fold to US$561 billion by 2024. But outstanding African corporate bonds fell from approximately US$52 billion in 2010 to US$38 billion in 2024 a 26.9% contraction and only 21 of 54 African countries have recorded a domestic corporate bond issuer since 2000. Africa is accumulating the savings it needs to finance itself. What it is not accumulating is the investable, local currency instruments those savings would need to buy. That divergence not the headline pool size is the allocation problem the Third Sustainable Capital Markets Conference is meeting to address.
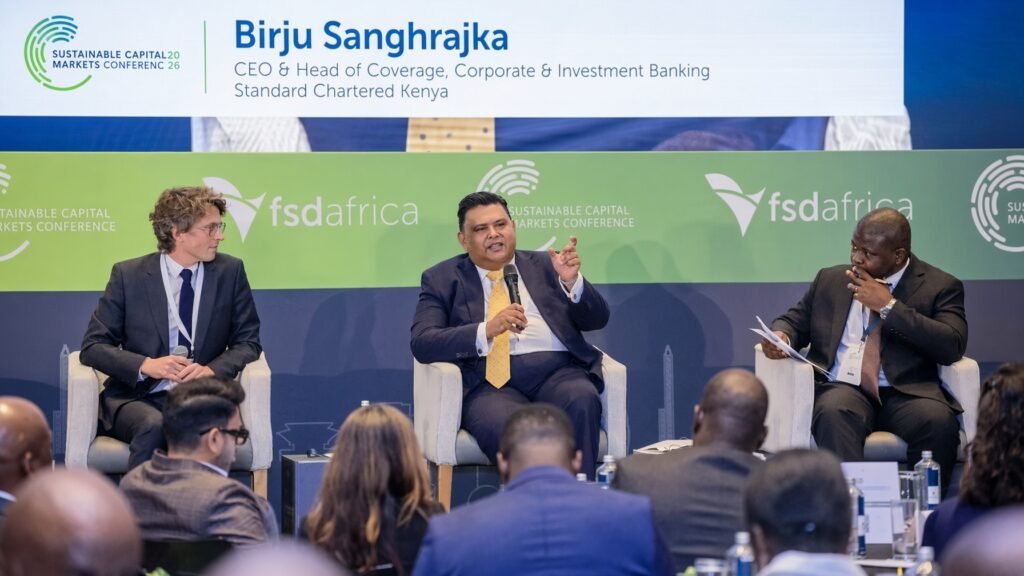
More than 300 policymakers, regulators and investors convened in Nairobi on September 15 and 16, 2026 as governments confronted higher debt servicing costs, constrained external financing and weaker foreign direct investment. FSD Africa says the conference is built around the problem of moving capital from where it sits to where it is needed. Organisers cite an estimated US$4 trillion pool held by African institutional investors including pension funds, insurers, banks and sovereign wealth funds with only 2.7% reportedly invested in infrastructure and other productive sectors.
Run that arithmetic and the scale becomes clear. At 2.7%, a US$4 trillion pool would imply approximately US$108 billion in productive sector allocation and approximately US$3.892 trillion parked elsewhere. The gap is not a savings problem. It is a transmission problem with two moving parts, and one of them is going the wrong way.
Methodological distinction: The US$4 trillion figure is cited by Sustainable Capital Markets Conference organisers and reflects a broad institutional capital definition. The OECD’s separate estimate uses a narrower institutional investor definition and placed African institutional investor assets at approximately US$1.1 trillion in 2024. The two figures are not contradictory they measure different asset coverage. The 2.7% productive sector allocation figure is likewise a conference organiser estimate and should be treated as directional rather than precisely audited.
Sources: Retirement Benefits Authority Kenya (pension assets, June 2025 base); OECD Africa Capital Markets Report 2025 (corporate bond stock, 2010 base) • Analysis: Limitless Beliefs Consulting • Note: Time frames differ (1-year pension growth vs. 14-year corporate bond trajectory). The chart compares direction of travel, not velocity.
Savings Are Compounding Corporate Bond Stock Is Not
Kenya’s pension sector reached KSh 3.167 trillion at June 2026, up from KSh 2.531 trillion a year earlier a 25.13% increase in a single twelve month period. Total contributions over the six months to June 2026 reached KSh 165.29 billion, up 28.83% year on year. That is real, compounding, domestic savings growth from a middle-income African market.
The instrument side tells the opposite story. Outstanding African corporate bonds fell from approximately US$52 billion in 2010 to US$38 billion in 2024, according to the OECD. Over the same period, equity market capitalisation across the continent expanded dramatically reaching approximately US$561 billion by 2024. So Africa’s equity markets grew and its corporate debt markets contracted. Kenya’s pension pool expanded. The bond instruments that a pension fund would typically allocate to in order to match long duration liabilities shrank in absolute terms.
This is not a story about Africa lacking savings. It is a story about the supply of savings growing faster than the supply of instruments those savings would need to buy. And it is a story about a market structure that has quietly become dependent on sovereign debt as the default home for institutional capital. The RBA’s most recent composition data show that government securities still represented 46.35% of Kenyan pension assets in June 2026 a reminder that when corporate bond supply is thin, institutional capital has nowhere to go but the sovereign curve.
“Africa is accumulating the savings it needs to finance itself. What it is not accumulating is the investable, local currency instruments those savings would need to buy.”
The $4 Trillion Pool and the 2.7% Slice The Size of the Parked Capital
Even if the conference’s US$4 trillion figure is read as generous the OECD’s narrower institutional investor estimate is approximately US$1.1 trillion the 2.7% productive sector allocation is the operative number. It suggests that the overwhelming majority of African institutional capital sits in government securities, bank deposits, listed equity and other permitted assets rather than in the infrastructure, energy, SME and climate assets that the conference is designed to mobilise.
FSD Africa identifies fragmented regulation, limited project pipelines, shallow secondary markets and a mismatch between institutional risk appetite and available investment products as the core structural constraints. Each of those is a supply side instrument problem, not a demand side savings problem. The savings exist. The investable products through which those savings could finance productive assets are what is missing.
The consequence is visible in the equity data as well. Africa accounted for approximately 2.5% of global GDP in 2024 but only around 1% of global outstanding corporate debt, according to the OECD. Africa’s share of global corporate debt is roughly 1.5 percentage points below its share of global GDP the widest such gap among major regions. Relative to emerging markets, the gap is narrower but still material: Africa represented approximately 6.1% of emerging market GDP but only about 5% of emerging market corporate debt.
Sources: FSD Africa / Sustainable Capital Markets Conference 2026 (pool size and productive-sector share); LBNN Intelligence (implied dollar decomposition) • Analysis: Limitless Beliefs Consulting • Note: Dollar figures are illustrative decompositions of the conference-cited proportions, not audited allocations.
Kenya’s Rates and the Currency Mismatch Why Local Instruments Matter
Kenya provides the monetary backdrop for the conference and illustrates why local currency instrument supply is the binding constraint. The Central Bank of Kenya reported a Central Bank Rate of 8.75% in August 2026, a 91 day Treasury bill yield of 8.767% on September 14, an average commercial lending rate of 14.39% in July, and consumer inflation of 6.6% in August.
Read together, those rates describe the hurdle domestic institutional capital faces. A Kenyan pension fund can earn approximately 8.77% nominally on a 91 day Treasury bill with essentially zero credit risk and near instant liquidity. An infrastructure or corporate bond must offer a spread sufficiently above that yield to compensate for illiquidity, credit, construction, operating, regulatory and currency risks and it must do so in a market where the securities regulator, the issuer’s governance and the secondary trading infrastructure may all be less developed than what institutional investors require.
The currency dimension compounds the problem. The OECD estimates that 53% of outstanding non-financial corporate debt in Africa was denominated in US dollars in 2024, and that 100% of the African corporate bonds in its dataset were USD denominated. Only 14 African countries had recorded any local currency corporate debt issuance between 2000 and 2024. The result is a structural mismatch: African institutional investors Kenyan pension funds, Nigerian PFAs, South African insurers — hold predominantly local-currency liabilities and are being asked to fund productive assets through instruments priced and serviced predominantly in foreign currency.
That mismatch is the reason domestic capital often does not flow into African corporate debt even when domestic savings exist. The instrument exists. It is just denominated in the wrong currency, at the wrong tenor and for the wrong investor base.
Sources: OECD Africa Capital Markets Report 2025, LSEG, IMF • Analysis: Limitless Beliefs Consulting
The Yield Spread Problem What Institutional Capital Requires
Even where local-currency instruments exist, the pricing has to work. A Kenyan pension fund earning 8.77% on a 91-day Treasury bill has a specific hurdle rate for any alternative asset. A local-currency infrastructure bond must offer a spread above that T-bill yield sufficient to compensate for duration risk, illiquidity, project execution risk and the possibility of regulatory change over the life of the investment.
If the spread is too thin, the pension fund stays in T-bills. If the spread is wide enough to attract the pension fund, the borrower’s cost of capital rises. That is the equilibrium domestic capital markets have to solve and it is much harder to solve when the secondary market is thin enough that the pension fund cannot sell the bond before maturity without taking a price concession.
DSCR — the Debt Service Coverage Ratio becomes the operative metric. A project generating cash flows that cover scheduled debt service by only 1.1x leaves little buffer for revenue volatility. A project at 1.5x gives the lender more room but may require higher tariffs, longer tenors or credit enhancement to reach that coverage level. Public guarantees and blended finance can bridge the gap, but the fiscal cost of those guarantees has to be disclosed and priced — otherwise the risk simply moves from the pension fund’s balance sheet to the taxpayer’s.
Sources: LBNN Intelligence, OECD, RBA Kenya, CBK, FSD Africa • Analysis: Limitless Beliefs Consulting
Sources: LBNN Intelligence, OECD, FSD Africa, RBA Kenya • Analysis: Limitless Beliefs Consulting
What Nairobi Should Measure Not How Much Capital, But How Many Instruments
The Africa Capital Markets Compact expected from the Nairobi meeting has a 12 to 24 month horizon. The measurable outcomes that would confirm the compact is working are specific: a higher volume of local currency corporate issuance, a broader set of issuer countries, deeper secondary market liquidity, lower transaction costs and a larger pipeline of infrastructure projects reaching financial close.
The outcomes that would confirm the compact is not working are also specific: corporate bond stock continuing to decline, pension allocations remaining concentrated in government securities, more African issuers turning to USD debt, and the productive sector allocation share remaining at or below 2.7%.
Increasing allocation targets without expanding the instrument menu is unlikely to close the gap. Pension funds and insurers have fiduciary obligations to their beneficiaries they cannot simply be instructed to absorb infrastructure risk. Governments cannot fill the supply gap by fiat if the resulting instruments are not investable. The policy objective has to be expanding the supply of investable, appropriately structured, appropriately priced local currency instruments not merely exhorting institutional investors to allocate more capital to a menu that does not yet exist.
The divergence between Kenya’s compounding savings pool and Africa’s contracting corporate bond stack is the analytical frame that makes this urgent. If the divergence persists, African institutional capital will keep accumulating in government securities and bank deposits, while productive assets are financed externally in foreign currency. If the divergence closes through local currency issuance, secondary market depth, credit enhancement and regulatory reform Africa’s savings can begin financing Africa’s productive capacity. Those are the two paths. The Nairobi conference has to choose which one it is building toward.
Bottom Line: Africa’s allocation problem is not a savings problem. It is an instrument problem and the two sides of that problem are moving in opposite directions. Kenya’s pension assets grew 25.13% in a single year, from KSh 2.531 trillion to KSh 3.167 trillion. Over the fourteen years to 2024, African corporate bond stock fell 26.9%, from approximately US$52 billion to US$38 billion. Equity markets expanded 27 fold to US$561 billion; corporate bond depth contracted. Only 21 of 54 African countries have recorded a domestic corporate bond issuer since 2000. The conference cited US$4 trillion institutional pool allocates only 2.7% to productive sectors implying approximately US$108 billion deployed and US$3.892 trillion parked elsewhere. The OECD’s narrower US$1.1 trillion institutional investor estimate does not change the direction of travel. The binding constraint is that 53% of African non-financial corporate debt is USD denominated and 100% of African corporate bonds in the OECD’s dataset are USD denominated, while only 14 countries have recorded local currency corporate debt issuance since 2000. That currency mismatch is why domestic savings do not flow into domestic productive assets even when domestic savings exist: the instruments are priced in the wrong currency, at the wrong tenor, for the wrong investor base. The Africa Capital Markets Compact will be judged not by its communiqué but by whether local currency corporate issuance rises, whether the bond stock reversal stabilizes, whether secondary market liquidity deepens and whether the productive sector allocation share moves above 2.7%. Until those metrics move, Africa will keep accumulating savings in one pocket and financing its productive assets with foreign currency from the other.
Data Qualification: This article combines capital markets data from the OECD Africa Capital Markets Report 2025, the IMF, LSEG and FSD Africa with pension and monetary data from the Retirement Benefits Authority of Kenya and the Central Bank of Kenya. The US$4 trillion institutional capital figure and 2.7% productive sector allocation are cited by Sustainable Capital Markets Conference organisers and reflect a broad institutional capital definition. The OECD’s separate estimate places African institutional investor assets at approximately US$1.1 trillion in 2024 under a narrower definition; the two figures measure different asset coverage and are not contradictory. The dollar decomposition of the US$4 trillion pool into productive and non-productive allocations (approximately US$108 billion and US$3.892 trillion respectively) is an illustrative calculation based on the conference cited proportions and should not be treated as audited allocation data. Kenya’s pension asset figures (KSh 2.531 trillion at June 2025, KSh 3.167 trillion at June 2026) are drawn from Retirement Benefits Authority data and represent a 25.13% year-on-year increase. The composition figure of 46.35% government securities is from the same RBA dataset. African corporate bond stock figures (US$52 billion in 2010, US$38 billion in 2024) and the currency composition figures (53% USD share of non-financial corporate debt; 100% USD share of corporate bonds in the OECD dataset; 14 countries with local currency corporate debt issuance) are from OECD reporting. The 21-of-54 countries figure for domestic corporate bond issuers since 2000 is also from OECD reporting. Kenya’s monetary rates (CBR 8.75%, 91-day T-bill 8.767%, average lending rate 14.39%, August inflation 6.6%) are from Central Bank of Kenya and Kenya National Bureau of Statistics reporting. The divergence framing treating Kenya’s savings growth and Africa’s corporate bond contraction as analytically paired is an LBNN/Limitless Beliefs Consulting interpretive framework, not an institutional market classification. Derived calculations are identified as Limitless Beliefs Consulting calculations and are not official forecasts.