
A handful of U.S. states pay top advisor salaries despite limited assets, reshaping hiring and growth strategies


For personal financial advisors, a small group of U.S. states combine top-quartile average salaries despite bottom-quartile state-wide assets under management, a mix that can complicate both hiring and growth strategy for RIAs. These are markets where financial advisor salaries are high, even though the state-level asset pool is relatively shallow.
Drawing on the Wealth Management Industry Annual Salaries dashboard, the latest data suggests that “cost to hire” and “capacity to gather” do not always move together, particularly outside the largest coastal wealth hubs.
THE HIGH-SALARY/LOW-AUM QUADRANT — WHO QUALIFIES, AND HOW EXTREME IT GETS
Personal financial advisors are those classified by the Bureau of Labor Statistics as helping individuals manage their money and plan for their financial future, whose numerous roles include financial planners, estate planning specialists, and private wealth advisors. Across the U.S. in 2025, their salaries in these roles averaged $94,800.
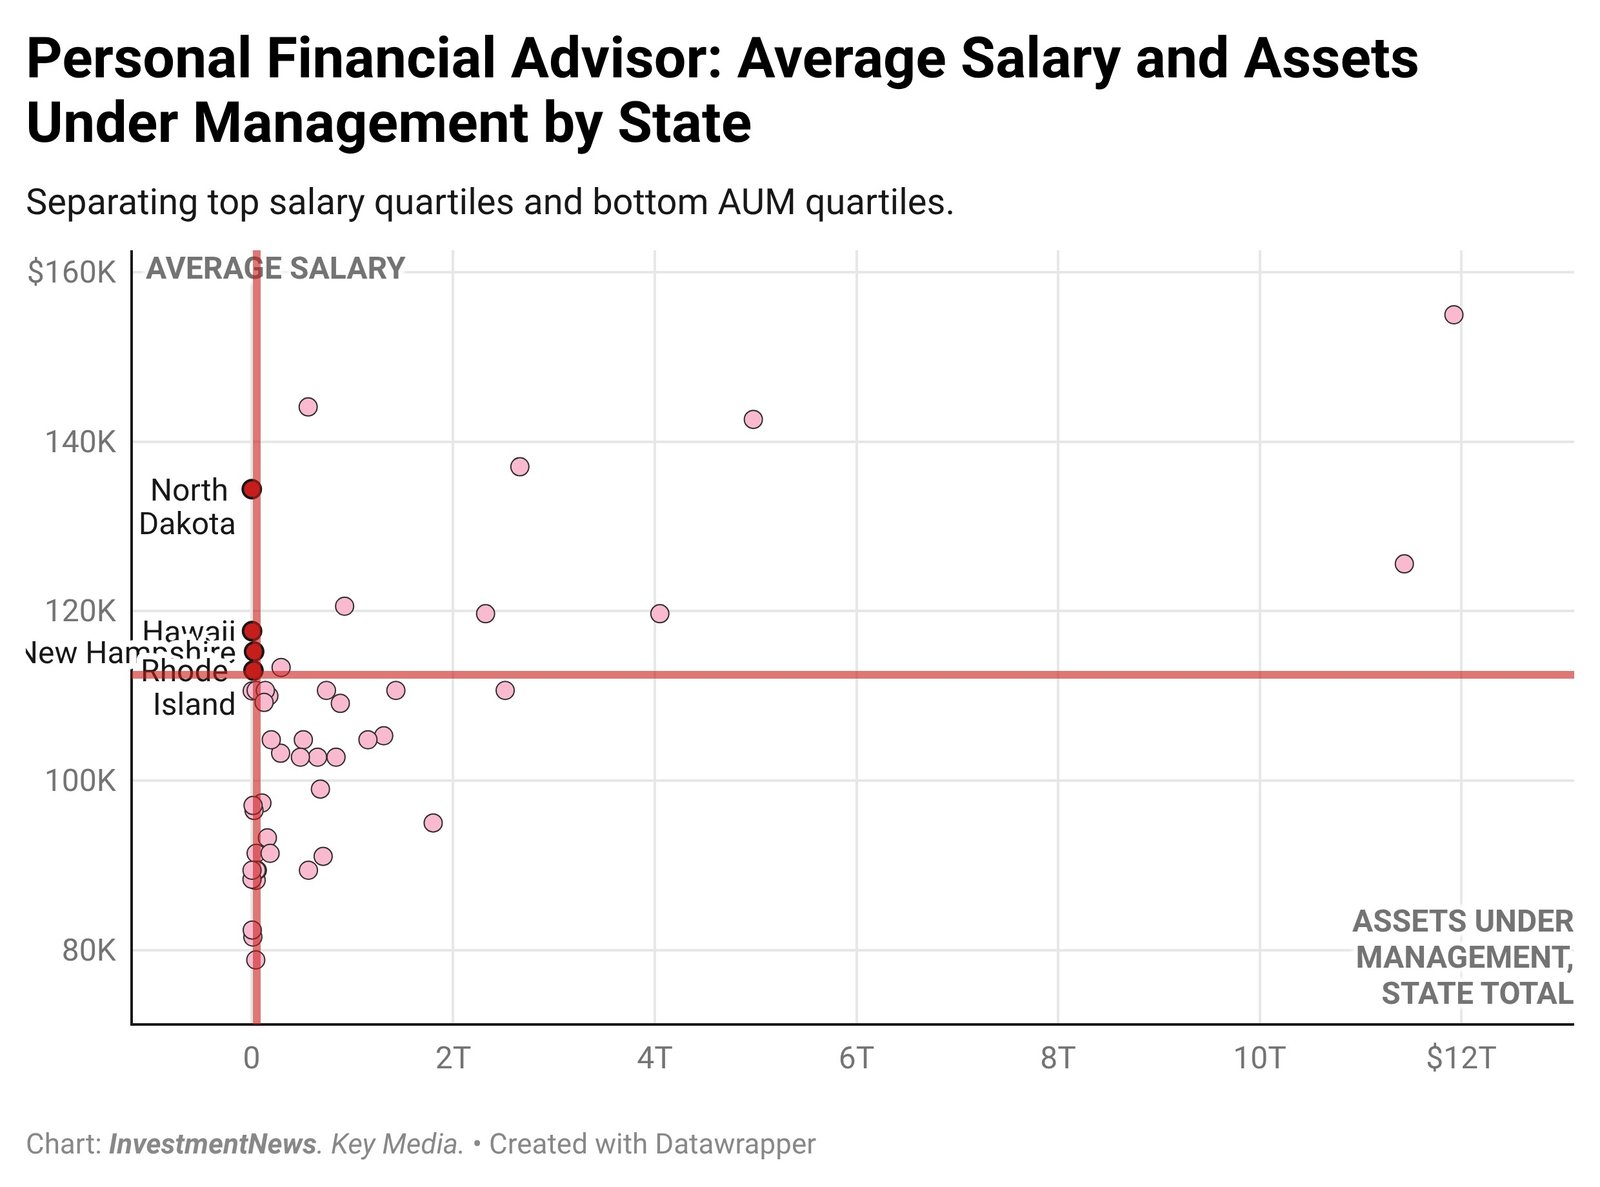
The highest paid 25% of personal financial advisors earned $112,411. Meanwhile, states with lowest 25% of assets under management oversaw no more than $42.31 billion state-wide.

Just four states saw personal financial advisors earn the nation’s leading salaries among its scantest AUM environments.
North Dakota is the most striking outlier: There, personal financial advisors earn an average of, $134,411.8, while the state has just $1.9 billion in total AUM. Hawaii also qualifies at $117,647.1 average salary and $4.69 billion AUM, pairing comparatively high pay with a very small state-level asset base.
Two smaller Northeast markets round out the quadrant. New Hampshire qualifies at $115,235.3 with $25 billion, while Rhode Island qualifies at $113,000 with $18.47 billion.
For context, the median state sits far higher on assets than this low-AUM quartile, with a median total AUM of $189.39 billion and a median salary of $104,823.5.
- Use the Wealth Management Industry Annual Salaries dashboard to flag markets where industry compensation runs hot relative to other metrics such as state-level AUM
- For expansion planning, treat high-salary/low-AUM states as potentially high-cost to staff, unless your growth model is regional or national.
- In compensation reviews, separate high-salary markets driven by large AUM pools (for example, New York: $155,000; $11,926.63 billion) from those driven by scarcity dynamics, because offer strategy and retention levers may differ
- For career decisions, weigh the pay premium against market depth: small-AUM states can pay well, but may offer fewer comparable employers if you need to move
ABOUT THE WEALTH MANAGEMENT INDUSTRY ANNUAL SALARIES DASHBOARD
- A compensation resource covering wealth management roles, including personal financial advisors, with state-level benchmarking
- Supports analysis that pairs pay metrics with market indicators such as total AUM to inform hiring and growth decisions
- Useful for identifying “tight labour” markets where salary does not track local asset scale in a simple way
SUBSCRIBE TO ACCESS THE FULL DATA


