


By Benoît Decerf, Nishant Yonzan, Seylorm Kwakuvi-Zagbedeh, Maria Eugenia Genoni and Christoph Lakner
– This is the tenth blog in a series of blogs about how countries can make progress on the interlinked objectives of poverty, shared prosperity and the livable planet. For more information on the topic, read the 2024 Poverty, Prosperity, Planet Report.
The World Bank has adopted two new measures to track shared prosperity: the Global Prosperity Gap (discussed below) and the number of economies with high inequality (introduced here). The Global Prosperity Gap captures how far a society is from $25 per person per day (using 2017 purchasing power parity $), which is close to the income of a typical person living in a country that enters high-income status. The Prosperity Gap is defined as the average factor by which incomes must be multiplied to reach the $25 standard for every member of that society. The Prosperity Gap decreases (or welfare improves) with rising incomes and decreases even faster when incomes of the poor grow more rapidly, or in other words, the decrease is greater through inclusive economic growth.
The prosperity gap is an improved measure of shared prosperity
The Prosperity Gap improves over the growth in the bottom 40 percent (the measure previously used by the World Bank) in the following ways: First, growth in the bottom 40 of countries cannot be aggregated to a global estimate. Similarly, a country’s growth in the bottom 40 cannot be broken down among regions or demographic groups, making it difficult to understand the drivers of aggregate changes. Second, the bottom 40 tracks most closely the growth in incomes of those who live close to the 40th percentile and largely ignores the growth of the poorest people in the country. Third, growth in the bottom 40 requires two comparable rounds of data over a particular time window. Meeting this condition has been challenging due to infrequent surveys and frequent breaks to survey comparability, particularly among the poorest countries.
As a result, in its latest edition, growth in the bottom 40 was available for only 26 of 80 low- and lower-middle-income countries (Global Database of Shared Prosperity, 13th edition, circa 2016–21). Last, while the bottom 40 captures inequality when explicitly compared with the growth in the mean, it leaves the link to inequality open to interpretation.
The Prosperity Gap, on the other hand, can be decomposed and aggregated into population subgroups, gives increasing importance to income of the poorest in society, can be assessed using a single round of data (like the reporting of poverty measures), and incorporates both changes in the mean and changes in inequality. To see how the Prosperity Gap gives greater weight to poorer people, consider two people living on $20 and $30, respectively, who are both within $5 from the $25 threshold. The person with $30 contributes 0.83 (=25/30) to the Prosperity Gap, while a person with $20 contributes 1.25 (=25/20), or 1.5 times the contribution of the person with $30.
Finally, the selection of the $25 prosperity standard does not affect comparisons by the Prosperity Gap. That is, selecting any other threshold would yield exactly the same comparisons over time or across countries. Together, the Prosperity Gap satisfies the main properties expected from a shared prosperity indicator (see this paper for detail).
The poorest regions contribute the most to the Global Prosperity Gap
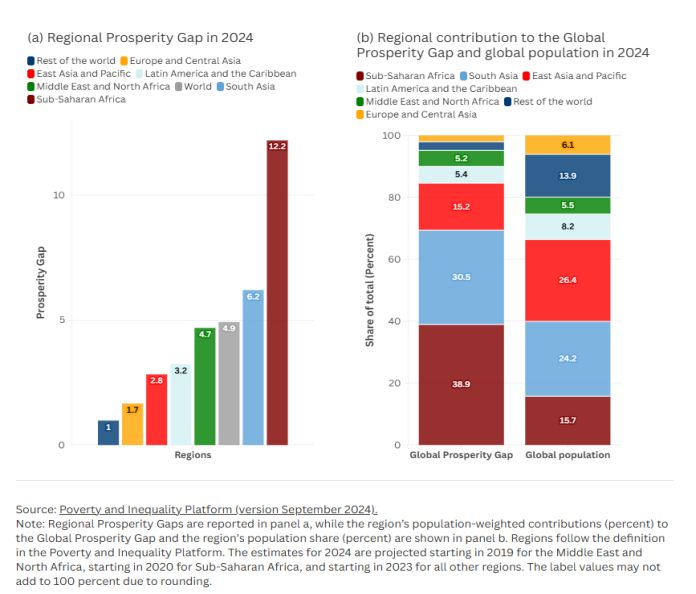
Figure 1 reports the Prosperity Gap of each region in 2024 in panel A, and the region’s contribution to the Global Prosperity Gap and the global population in panel B. The shortfall was greatest in Sub-Saharan Africa. The Prosperity Gap of the region was 12.2, meaning that on average incomes needed to be multiplied more than 12-fold to reach the $25/day standard. South Asia was next with a gap of 6.2, followed by the Middle East and North Africa (4.7) and Latin America & the Caribbean (3.2). The Global Prosperity Gap was 4.9 implying that the incomes needed to increase on average 5-fold for everyone around the world to reach the $25/day standard. Sub-Saharan Africa contributed close to 40 percent of the global shortfall despite accounting for only 16 percent of the global population. While contributing close to a quarter of the global population each, South Asia and East Asia contributed 30 percent and 15 percent respectively to the Global Prosperity Gap.
Figure 1: Sub-Saharan Africa has the highest Prosperity Gap and contributes the most to the Global Prosperity Gap, followed by South Asia
Progress in reducing the Prosperity Gap in the three decades before the Covid-19 pandemic has slowed since
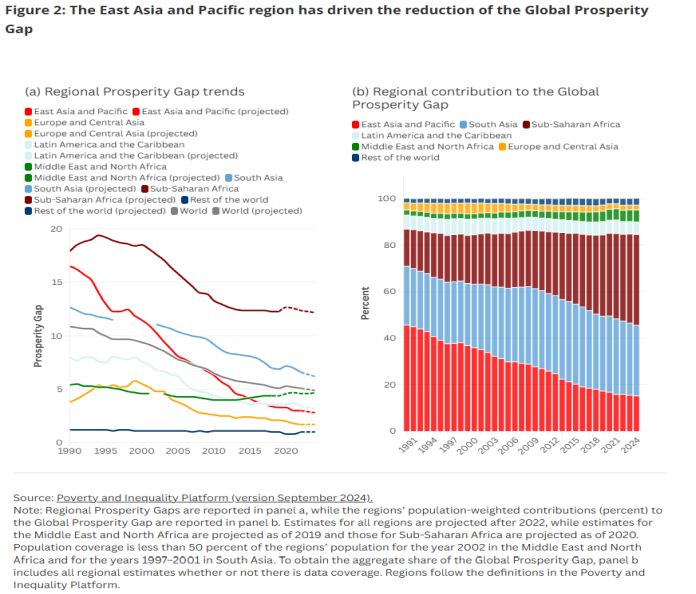
The Global Prosperity Gap, like the reduction in poverty, has been reduced considerably over the past three decades. Figure 2 reports the trends (panel a) and contributions (panel b) for all the regions from 1990 to 2024. In 1990, the global shortfall stood at 10.9 compared to 4.9 in 2024. The reduction of the Global Prosperity Gap by more than half was driven mostly by the improvement in welfare in East Asia, where the Prosperity Gap declined from 16.5 in 1990 to 2.8 in 2024. The changes imply that East Asia’s contribution to the global gap has improved from 46 to 15 percent. Likewise, South Asia halved its regional Prosperity Gap from 12.7 to 6.2 in the same timeframe. However, given the relative faster decline in East Asia and the World, South Asia’s relative contribution to the Global Prosperity Gap has increased somewhat from 25 in 1990 to 30 percent in 2024. The same pattern, but much more pronounced can be observed for Sub-Saharan Africa: Due to a slow reduction in the regional Prosperity Gap, as well as an increasing population share, the region now contributes the most to the Global Prosperity Gap.
Figure 2: The East Asia and Pacific region has driven the reduction of the Global Prosperity Gap
The Prosperity Gap can be decomposed as the product of $25/mean income and inequality (see Annex 2B of the Poverty, Prosperity, and Planet Report). This formulation hints that this index decreases (or shared prosperity improves) as mean income increases, or as inequality decreases. While the Prosperity Gap in Sub-Saharan Africa is the highest among all regions in 2024 (12.2), policies that would raise average income and reduce inequality will lower the gap in the region. Both East Asia and South Asia have more than halved their Prosperity Gaps in the last three decades having started at a higher level than Sub-Saharan Africa in 1990. For East Asia, the increase in mean income contributed roughly 2/3rd of the progress in reducing the Prosperity Gap in the last three decades, the rest was due to the reduction in (regional) inequality.
– The authors gratefully acknowledge financial support from the UK Government through the Data and Evidence for Tackling Extreme Poverty (DEEP) Research Program.


