
In the past month, BTC selling revealed the steepest capitulation since 2022. The Aggregate 30D Realized Cap turned sharply negative, showing the ongoing absorption of real losses.
The BTC downturn from $90,000 to the $60,000 range was caused by the steepest capitulation since 2022. The market downturn showed multiple sources of selling pressure, coming from ETFs, strategic trader whales, as well as long-term holders.
This time around, the supply of stablecoins has remained flat, with no new minting and inflows of liquidity.
In early February, signs of a market capitulation were already present, and the selling has only deepened. At the current price range, the question of a local market bottom is still uncertain. Previous deep capitulations could continue for a while before a price reversal.
For BTC, even a price rally may not be enough to sustain a lasting recovery, as some holders may sell at or near their breakeven levels.
The ongoing capitulation kept BTC stuck in a range above $67,000, as any attempts to break out above $70,000 led to selling. The capitulation may continue, as predictions see BTC sliding as low as $50,000.
BTC realized cap declines as selling continues
The BTC realized market cap has been in decline since the October 2025 downturn. The metric is still a lagging indicator, which shifts more slowly. Some of the selling in the past months was still at a relatively high range.
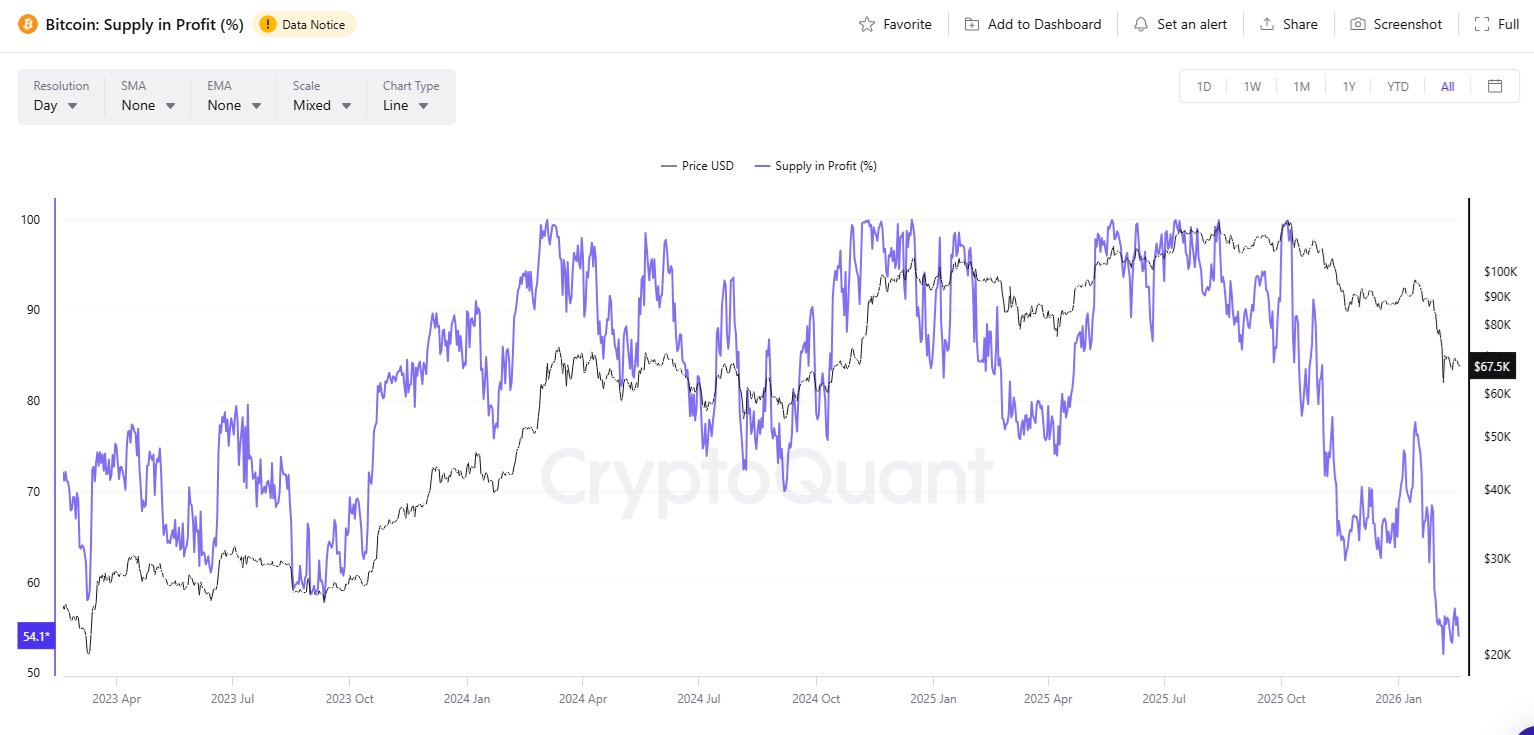
Currently, only 55% of the BTC supply is held in profit, down from over 99% in October 2025. The longer period of weakening prices has led to a mix of strategic selling, panic, and capitulation.

A significant part of the selling may be due to forced liquidations, rather than deliberate shedding of positions. Despite this, some notable whales have started to divest, with ongoing BTC inflows into Binance in the past month. The other major source of price pressure may be a miner capitulation as pools now more actively sell off their rewards.
The recent selling also keeps the BTC fear and greed index in the “extreme fear” territory at 12 points, with almost no recovery in the past few days.
Is BTC facing a longer bear market?
The short-term price movements for BTC may include rallies to a higher price range. Sideways trading is also a possibility.
There is no consensus for the end of the drawdown, and for some, the directionless trading may continue until the end of the year.
BTC is now down by 45% from its price record, moving with continued losses for 135 days since the peak. Previous price cycles have shown that over 200 days are often spent in sideways trading, while rallies last only a few weeks or even days.
For now, silent accumulation may continue, but selling pressure remains, and a local bottom for BTC is expected at a later stage in the cycle.


